
Frost to start, 70° by the afternoon
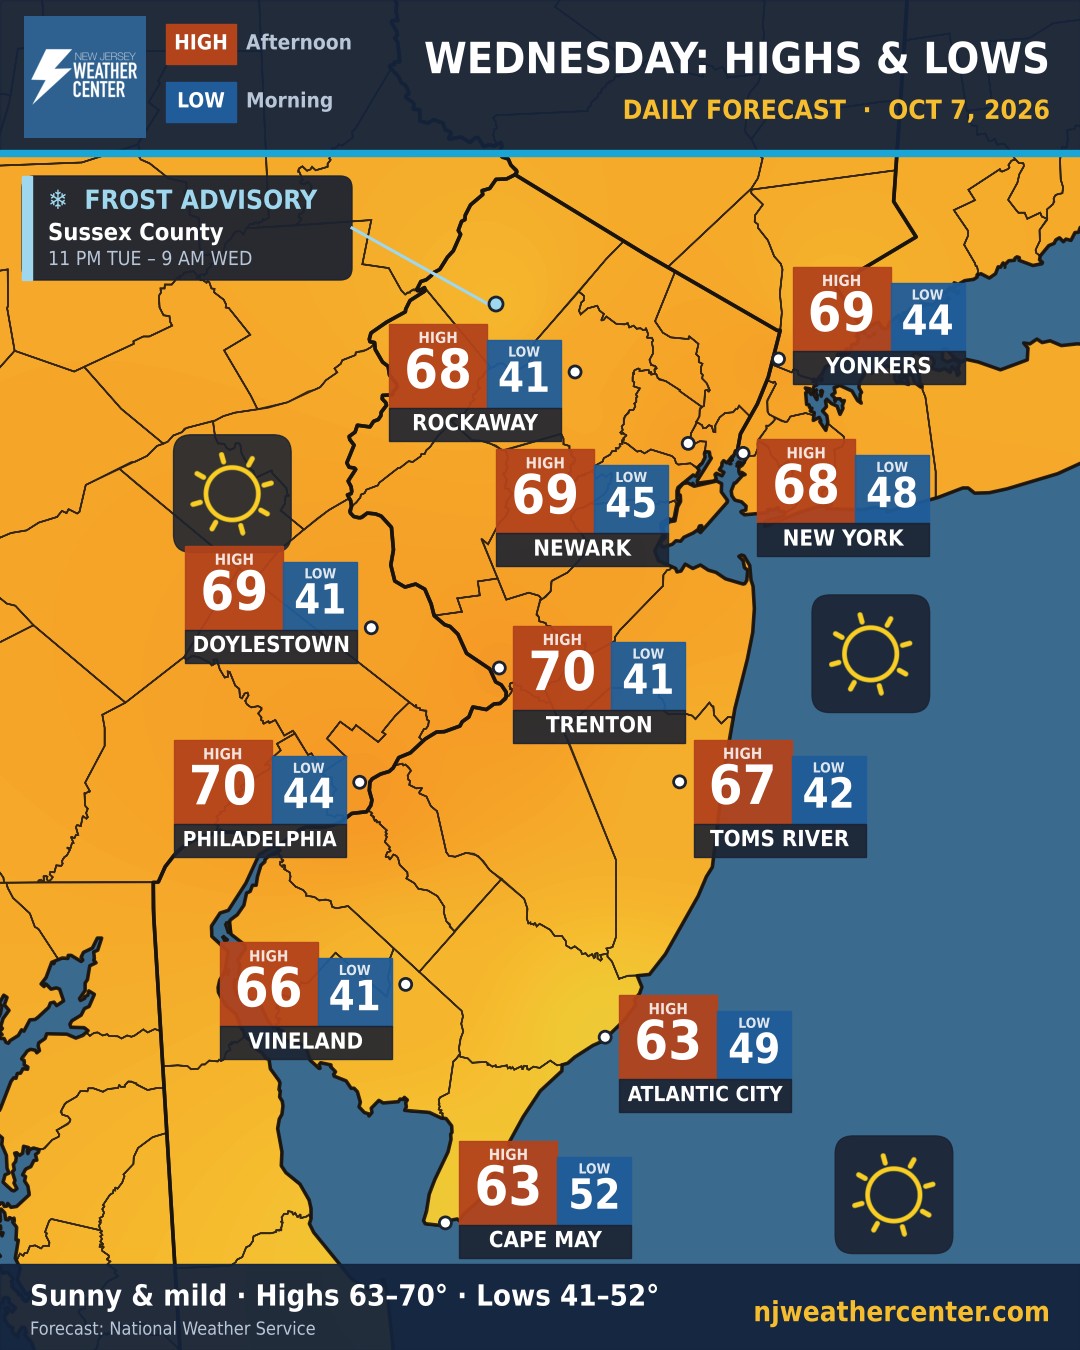
Clear skies and light winds tonight let the day's warmth escape fast, so Wednesday starts cold. Most of us wake up in the low 40s, and Newton in Sussex County drops to about 36°.
Then the sun takes over. Highs reach the upper 60s to near 70 inland, and the low 60s at the shore. That's a swing of about 30 degrees in some spots. The ocean keeps Cape May to only 11.
Frost Advisory for Sussex County from 11 PM Tuesday until 9 AM Wednesday, with temperatures as low as 33° in spots. Cover or bring in sensitive plants.
Tropical Depression Nine: what it could mean for New Jersey
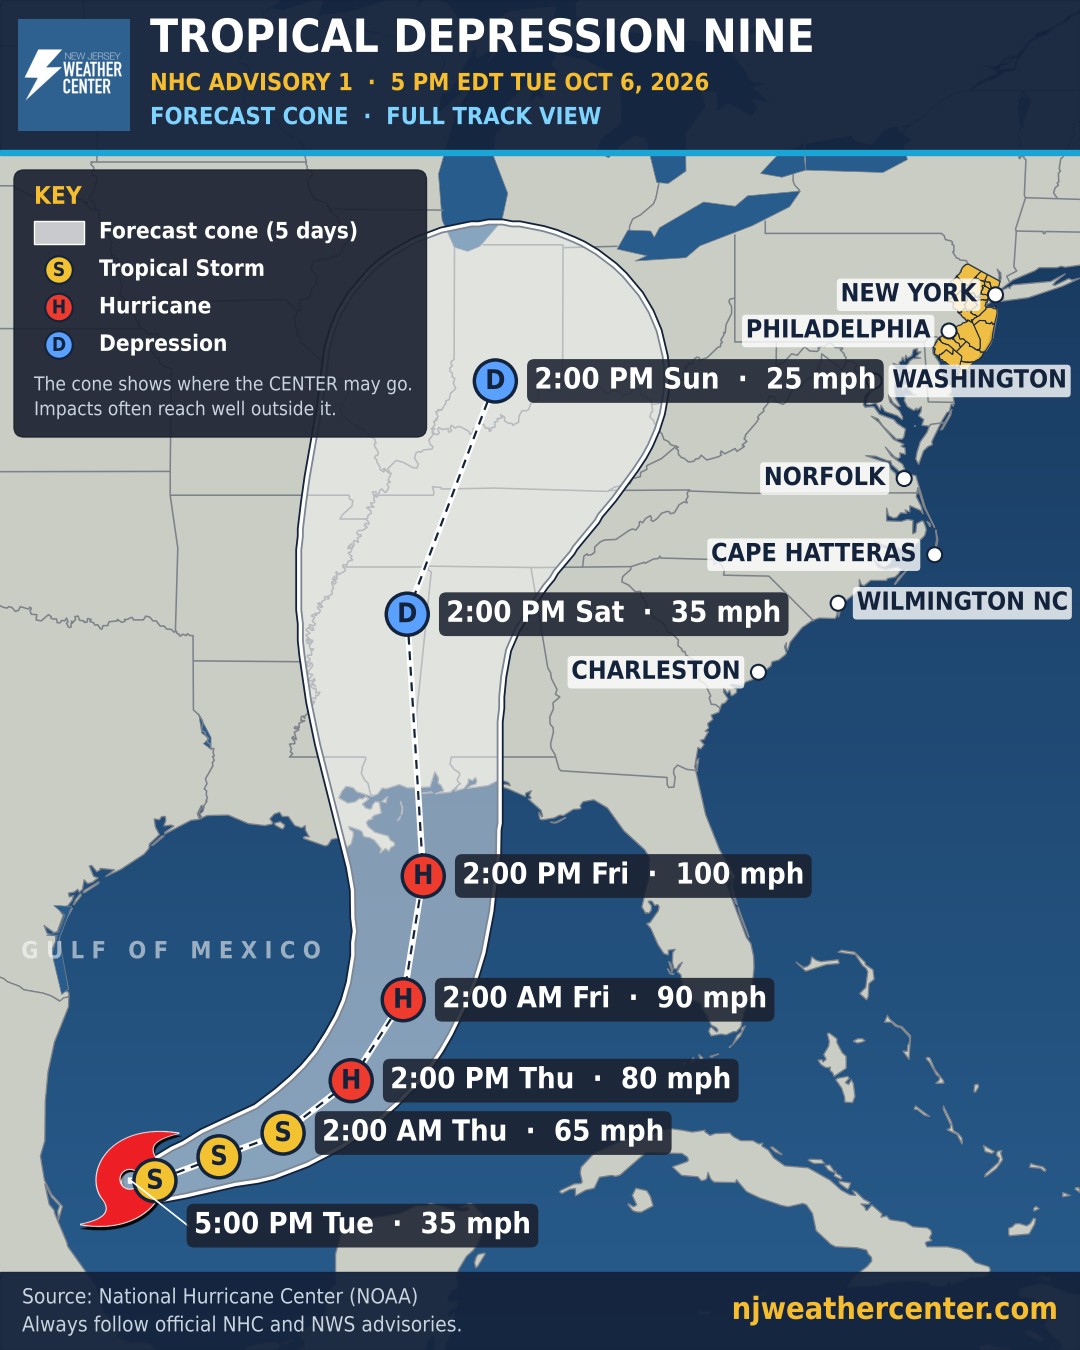
A new tropical depression formed in the Gulf of Mexico on Tuesday. The National Hurricane Center expects it to become a tropical storm by early Wednesday and a hurricane by Thursday, with a forecast peak near 100 mph on Friday along the northern Gulf Coast.
After that, the forecast has it weakening as it moves north into the middle of the country. The cone, which shows where the center of the storm could go, stays well west of the Northeast through the weekend.
For us: our area may see some rain from what's left of this system, but the timing is up in the air. One possibility is Sunday night. That's still several days away, and a lot can change before then, so treat that as a heads-up and not a forecast. We'll firm it up as the track gets clearer.
No watches or warnings are in effect yet. We update this map with every new National Hurricane Center advisory.
Heading to the game? We post a game-day forecast for every Yankees, Giants, Jets, Red Bulls, NYCFC and Westchester SC home game: the temperature at the start and the end, the sky, rain chance and wind at the stadium. Teams show here while they still have home games left this season.
Today's game-day forecasts
No home games on today's schedule. Game-day forecasts show up here on game day. See what they look like.
Past game-day forecasts: Sports Archive. NJ Weather Center isn't affiliated with any team or league. Team names are used only to identify the games.
Active alerts
Loading the latest alerts from the National Weather Service…
Colors follow the National Weather Service. Tap an alert to read the headline. For full details and safety information, always check weather.gov.
When weather slows things down, we post an airport delays map (from the FAA) and a road conditions map for the major highways, from green (no problems) to red (extremely dangerous).
No weather travel problems right now. See what the maps look like: Airport Delays · Road Conditions. Live updates: FAA airport status · 511NJ
A quiet week, and that's a good thing
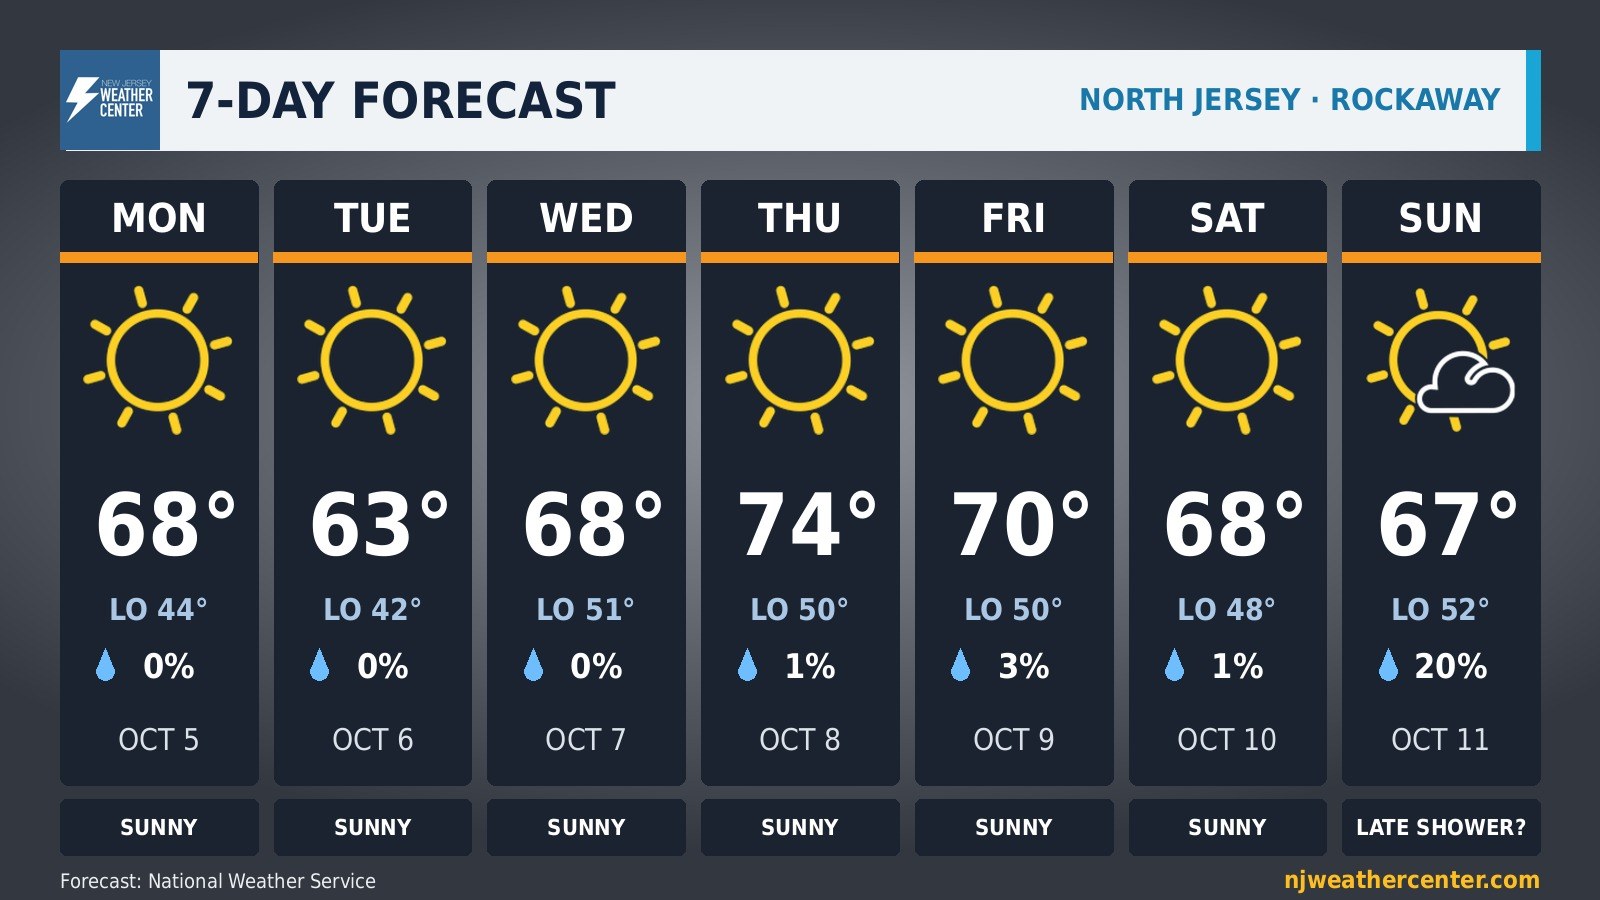
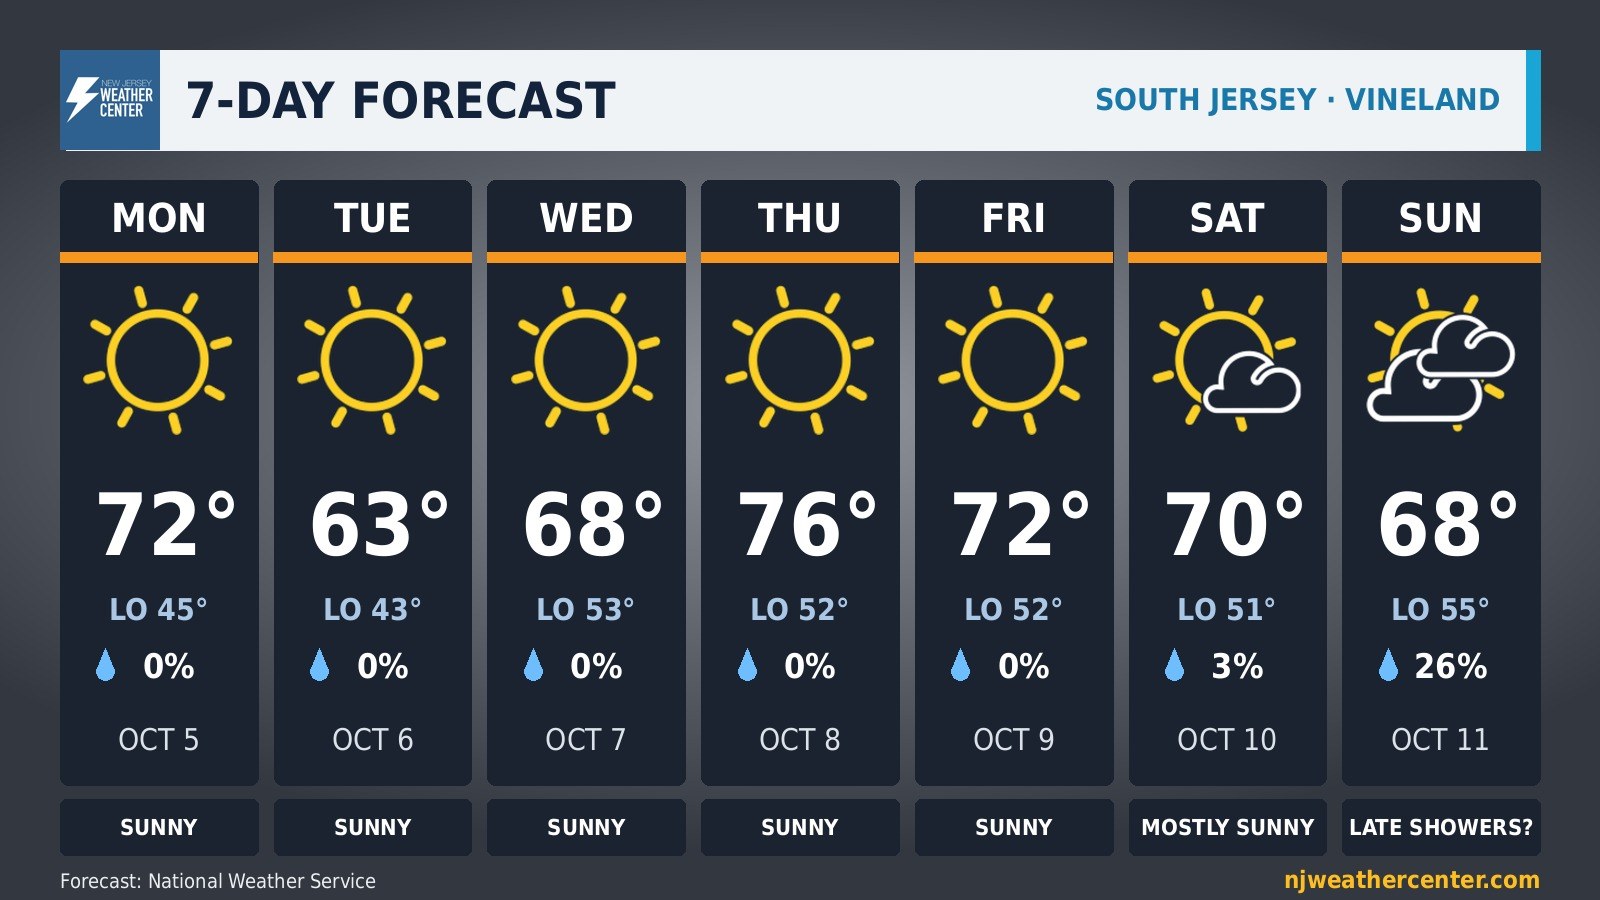
Most people think October around here means gray, rainy days, but this week is about as easy as it gets. North and South Jersey both stay sunny or mostly sunny through Saturday, with highs in the 60s and low 70s. Thursday is the warm one: 74 in Rockaway and 76 in Vineland.
Tuesday night is the coldest of the week (42 in Rockaway, 43 in Vineland), so keep the jacket handy for early mornings. The first real chance of rain doesn't show up until Sunday night, and even that's only 20 to 26 percent.
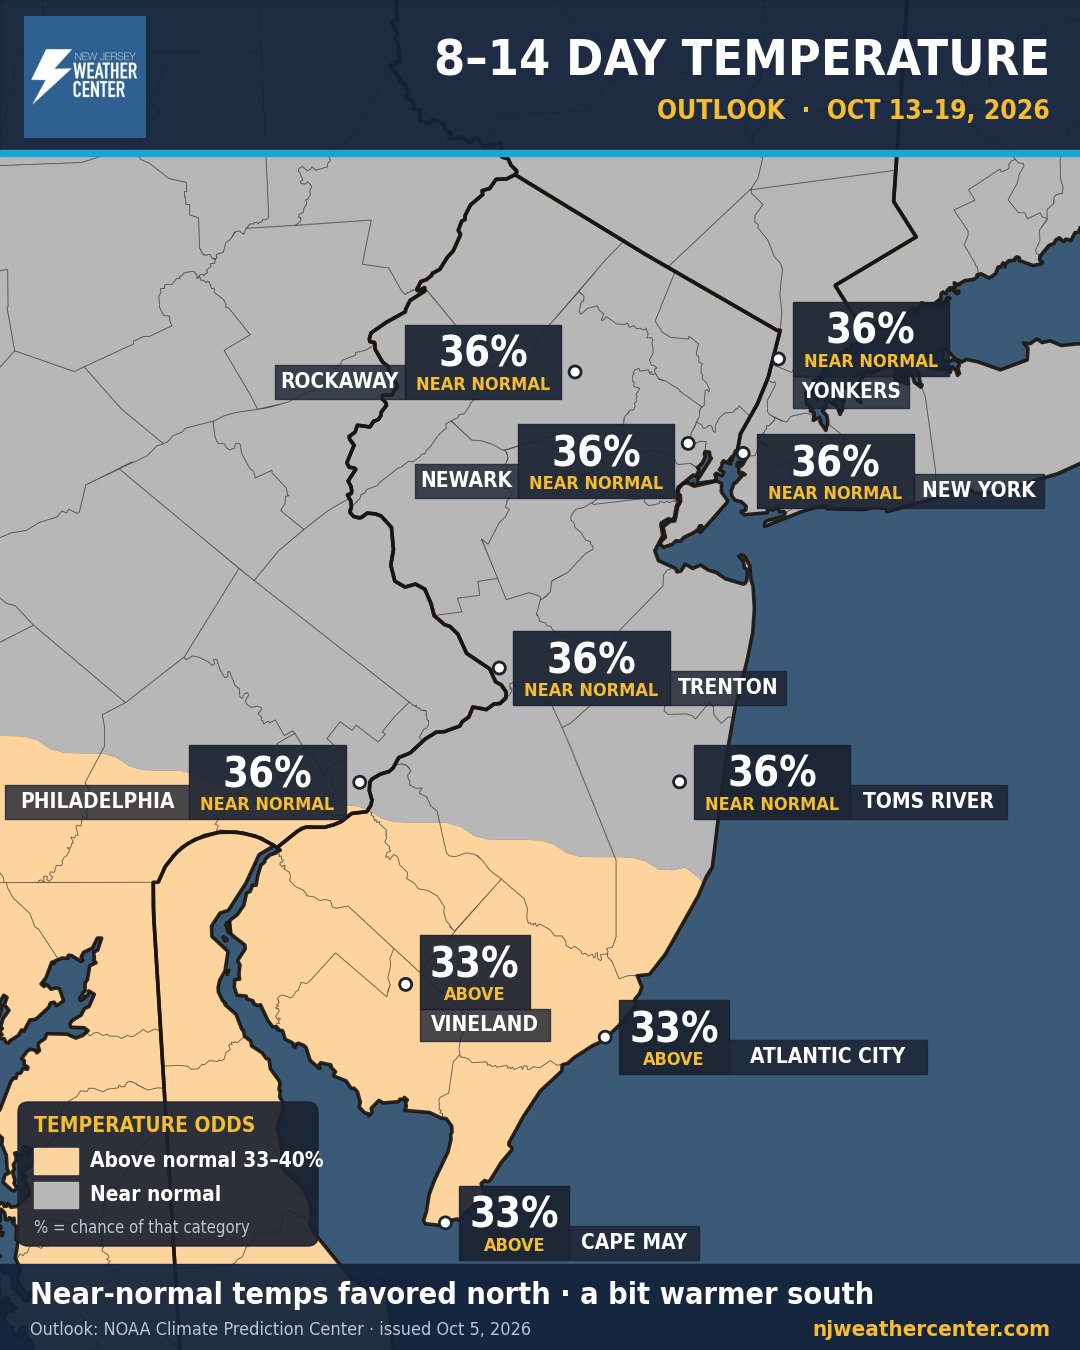
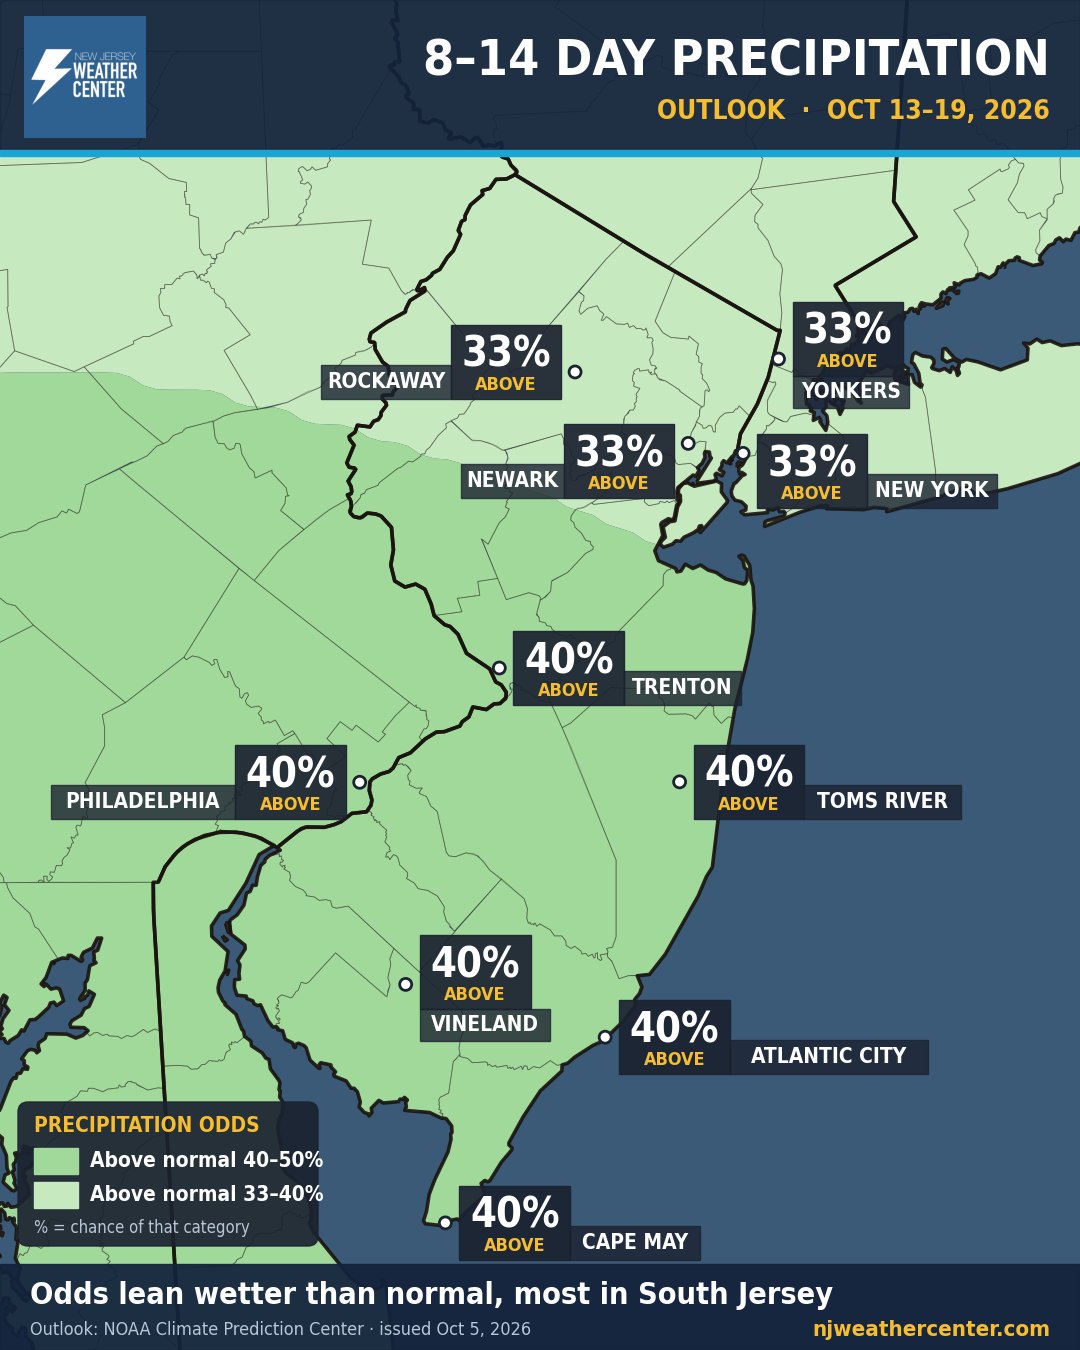
Mid-October looks seasonable, with a wetter lean
This is the big-picture look at Oct 13–19. It's not a day-by-day forecast. Think of it like the odds on a game: NOAA's Climate Prediction Center gives the chance that the week as a whole runs warmer, colder, wetter or drier than normal for mid-October.
Temperatures: near normal is the best bet for North and Central Jersey, NYC and Philly. South Jersey leans just a little warmer than normal.
Rain: the odds lean wetter than normal for everyone, a 40–50% chance from Trenton and Philly down to Cape May, and 33–40% up north. That doesn't mean it rains every day, just that the week tilts wet. After this week's sunny stretch, it's one to keep an eye on.
Get the forecast in your inbox
Sign up for email alerts from NJ Weather Center. Pick what you want: the morning forecast, a heads-up when a storm is coming, or game-day forecasts. Unsubscribe anytime.
Yesterday's answer
A new question every morning. Come back tomorrow!
What we post
Here's what you'll see from NJ Weather Center. Daily maps go up every morning. Storm, tropical and severe maps go up when the weather calls for them. Click any one to see an example and how to read it. Storm examples are made-up storms, not real forecasts.
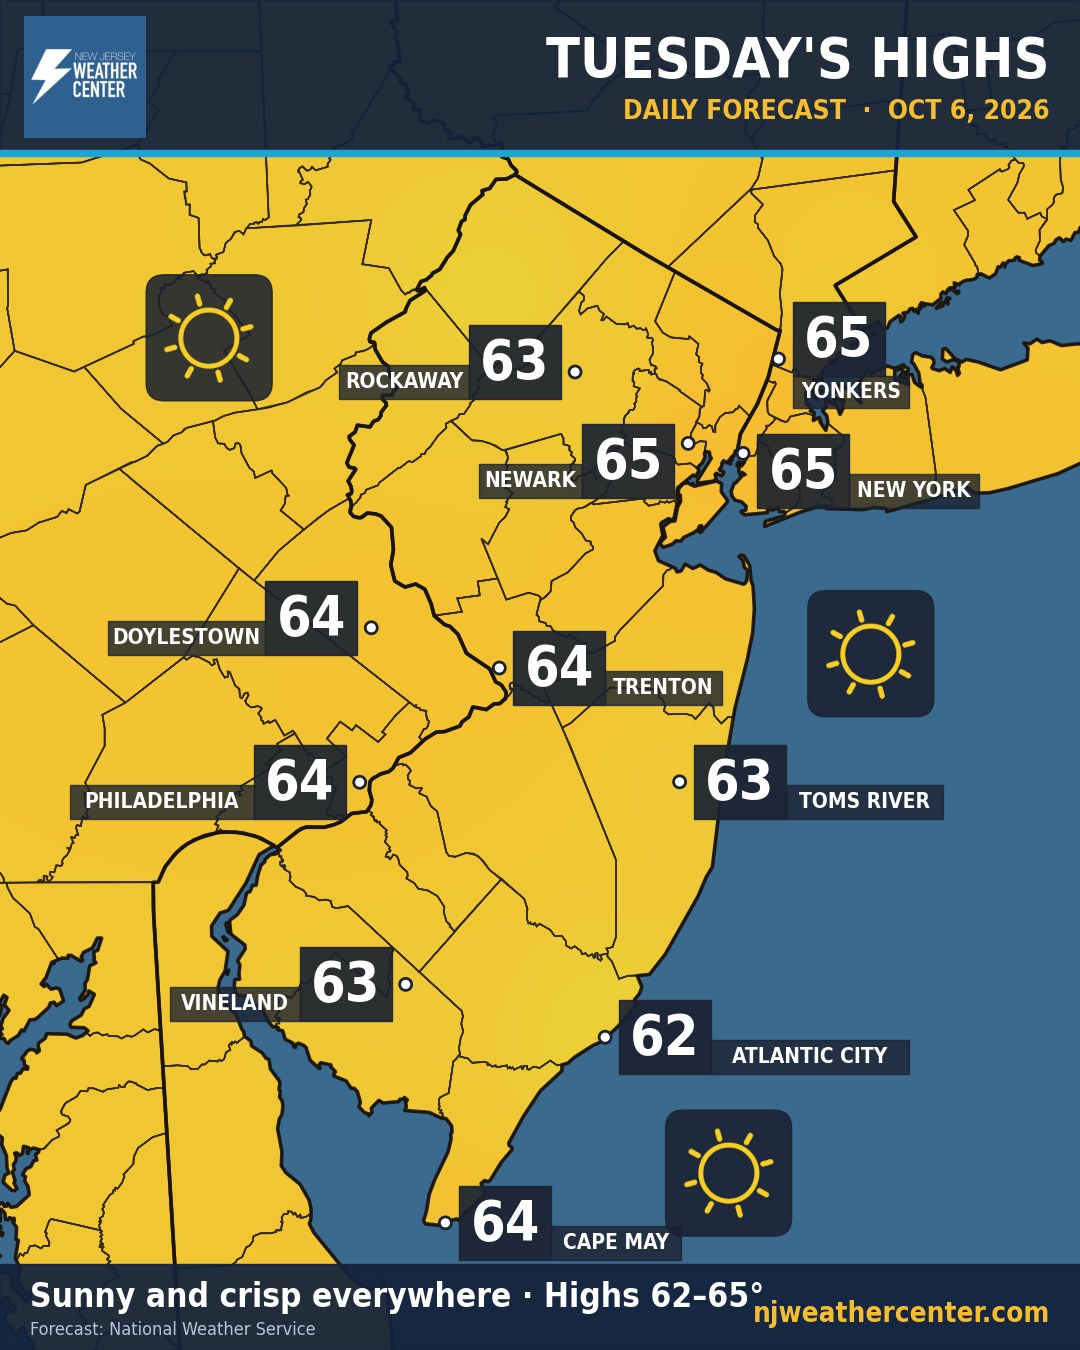
Afternoon highs and sky conditions for 11 cities across NJ, NYC, Westchester, Bucks and Philly.
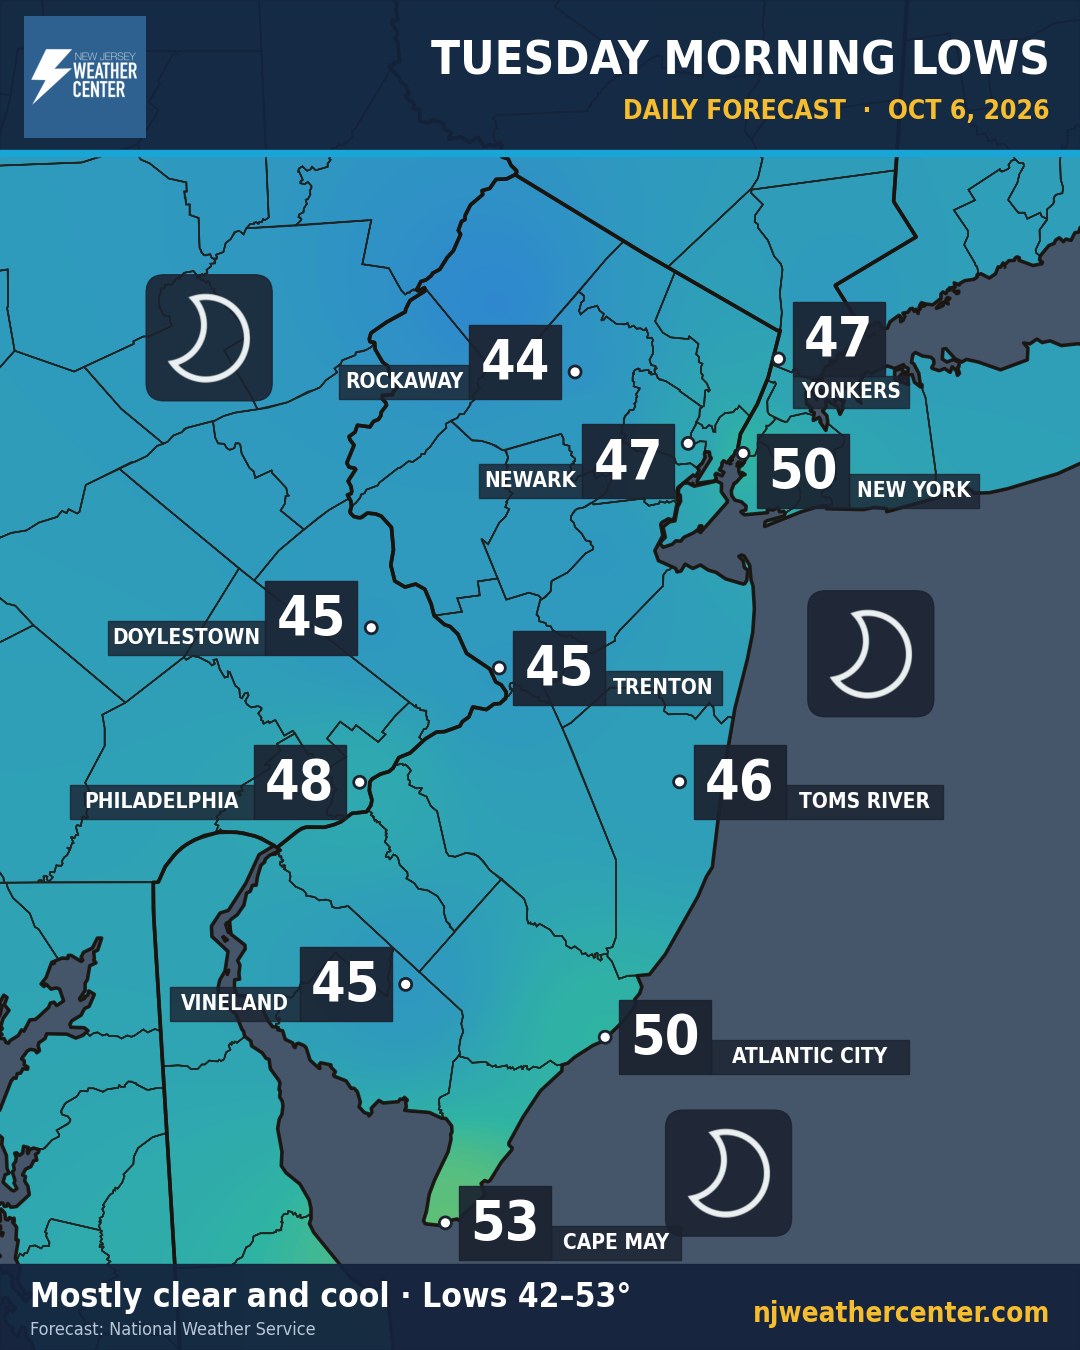
How cold you wake up, so you know if it's a jacket morning.
The week at a glance: highs, lows, rain chances and the sky, with a short write-up.
The odds that week two runs warmer, colder, wetter or drier than normal, from NOAA's Climate Prediction Center.
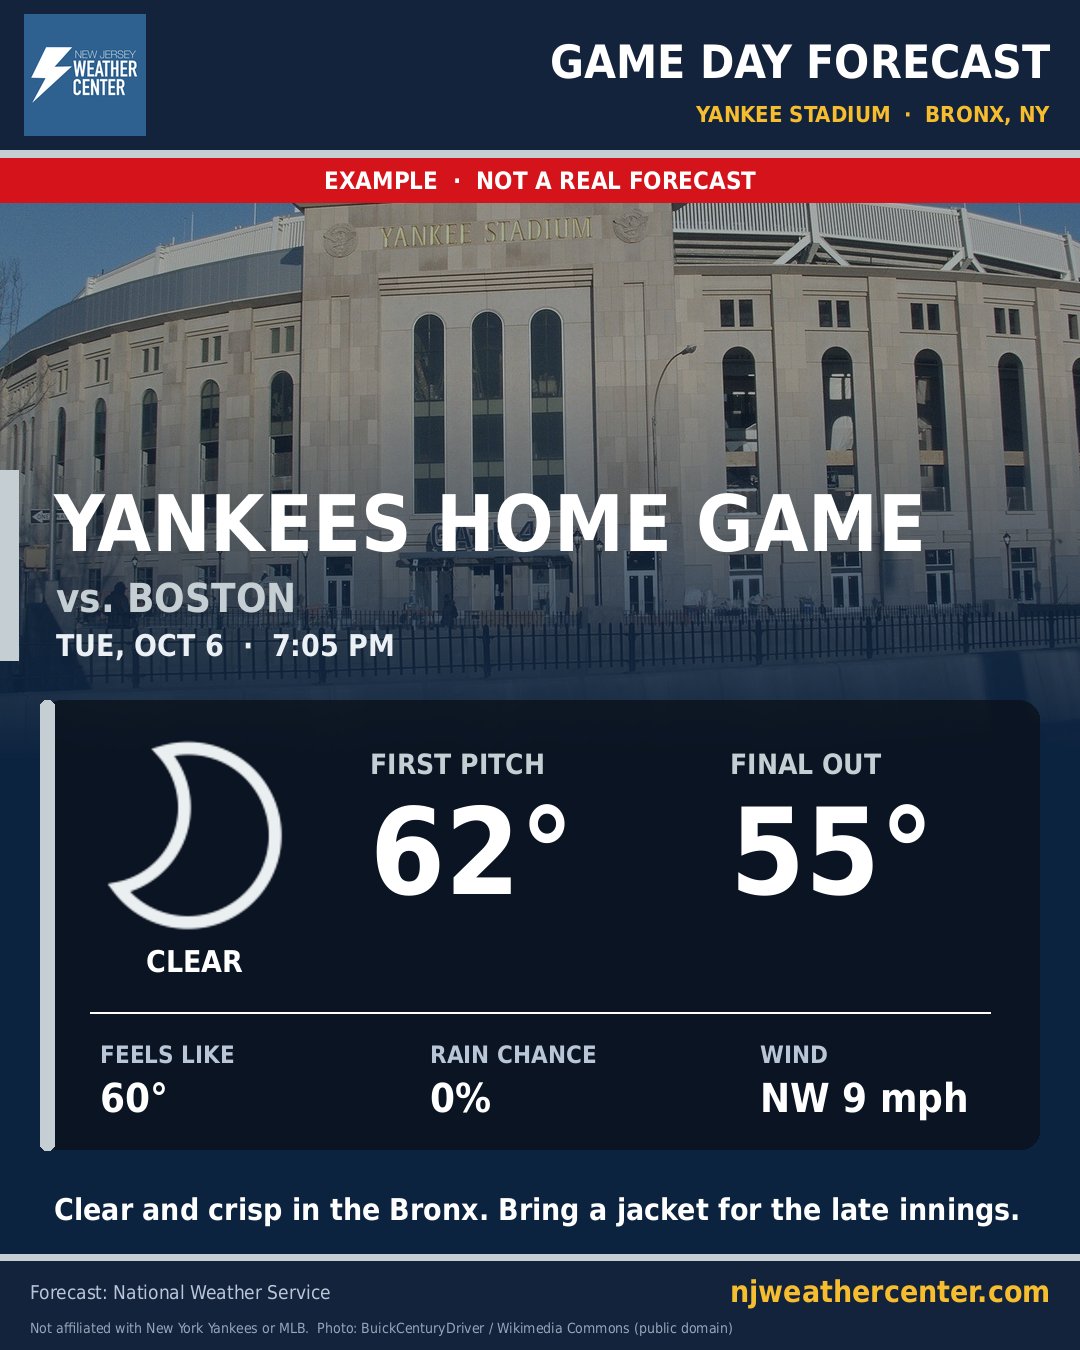
Yankees, Giants, Jets, Red Bulls, NYCFC and Westchester SC home games: start and end temps, rain and wind at the stadium.
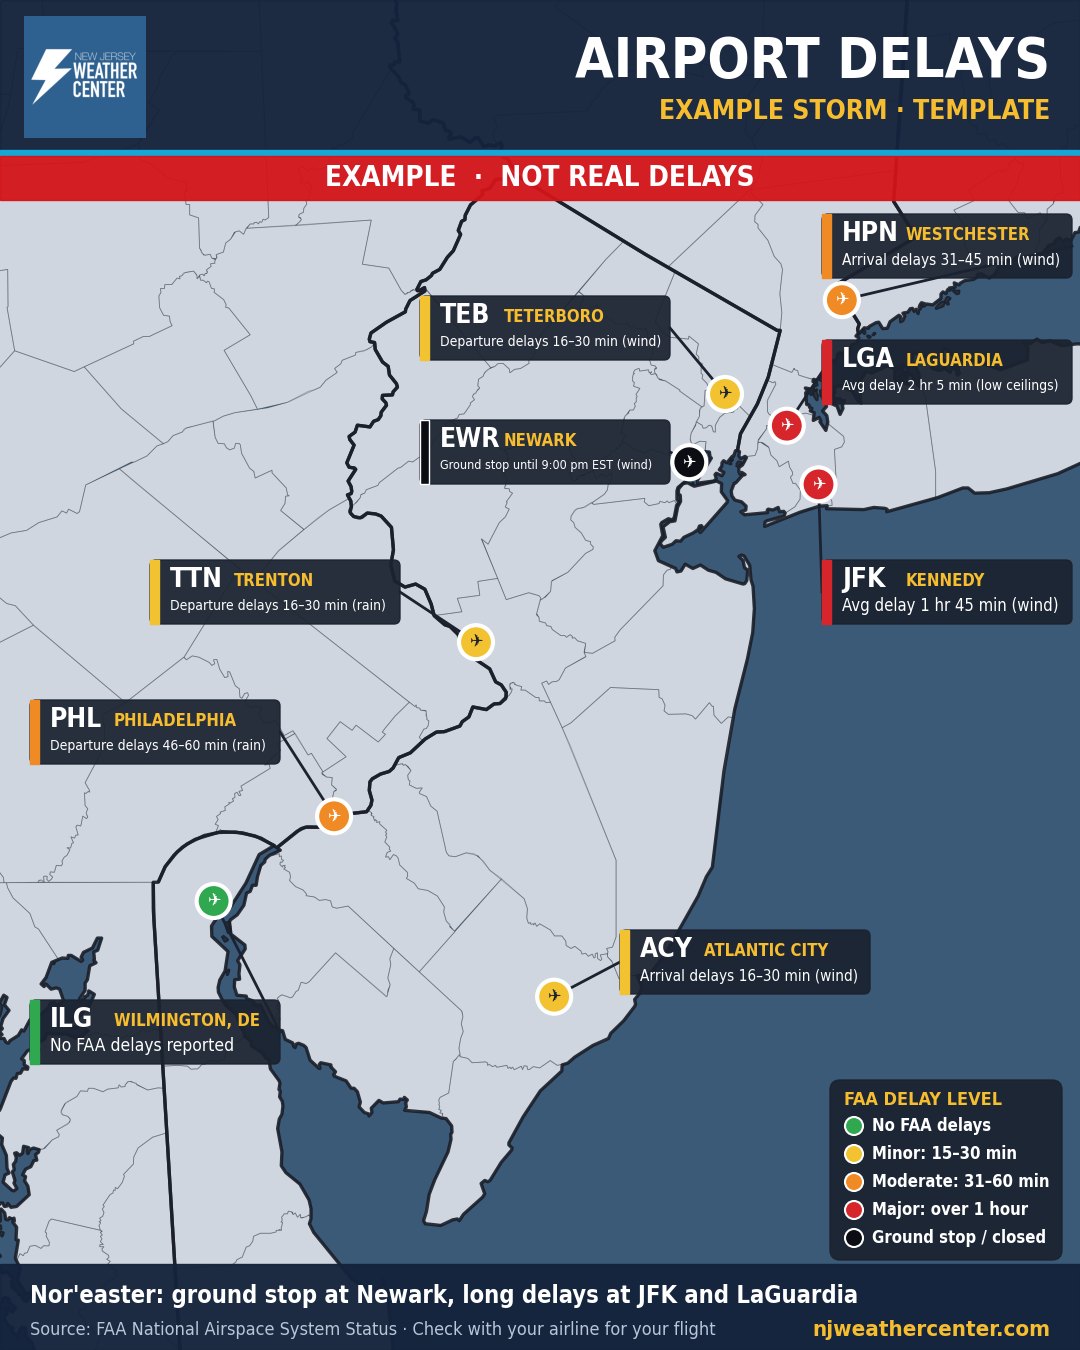
Delays, ground stops and closures at Newark, JFK, LaGuardia, Philly and the other airports around us, from the FAA.
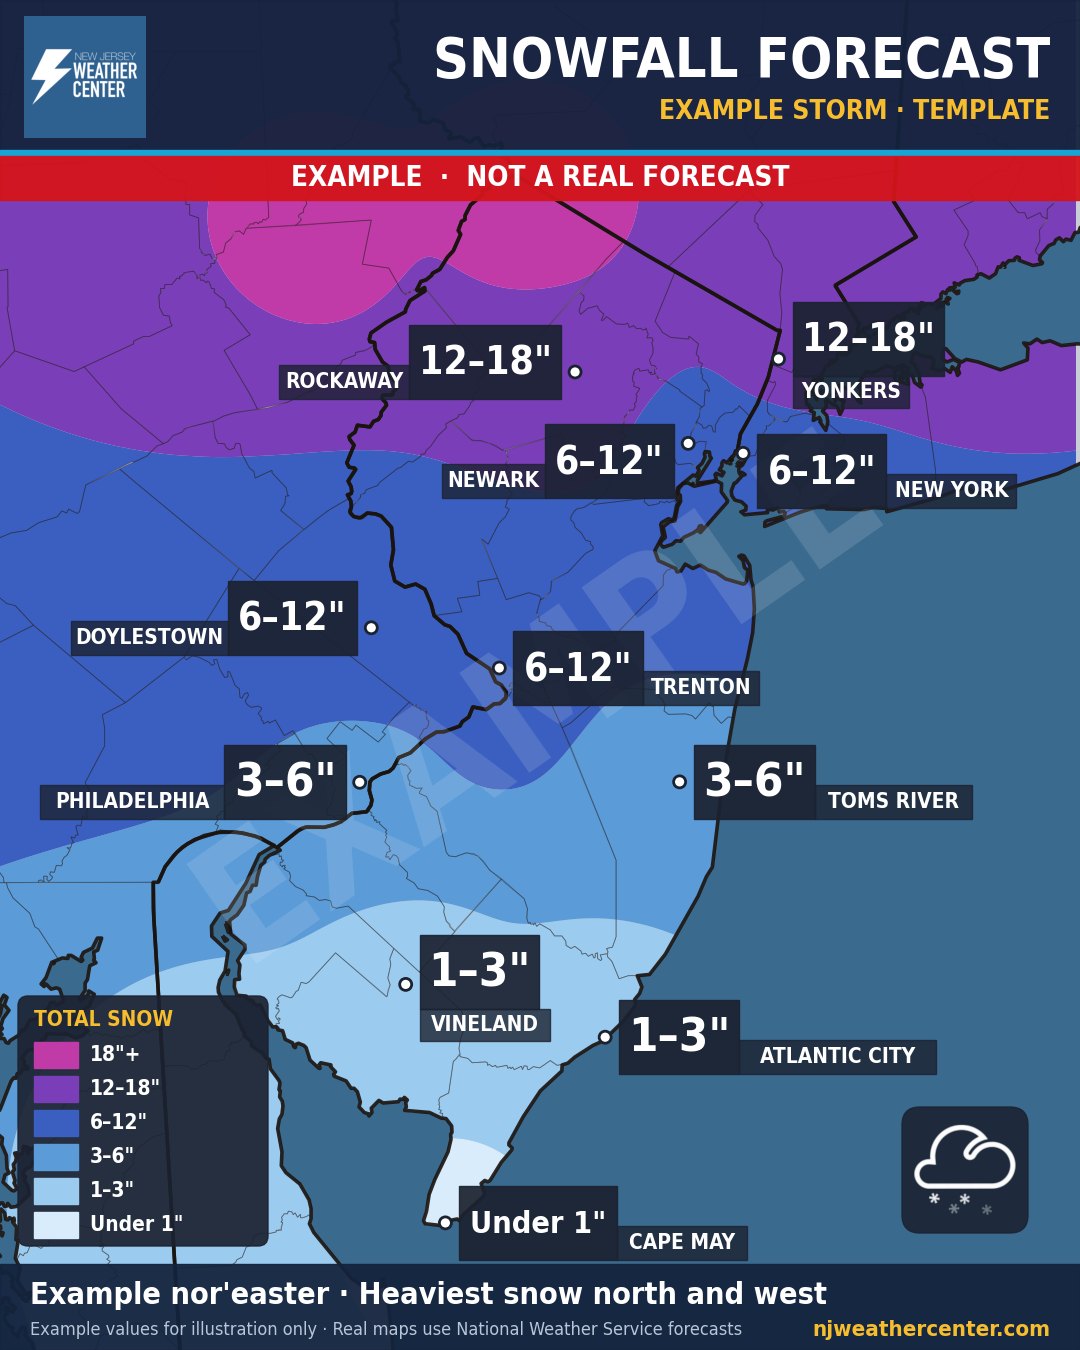
Who gets how much, where the heaviest bands set up, and where it turns to rain.
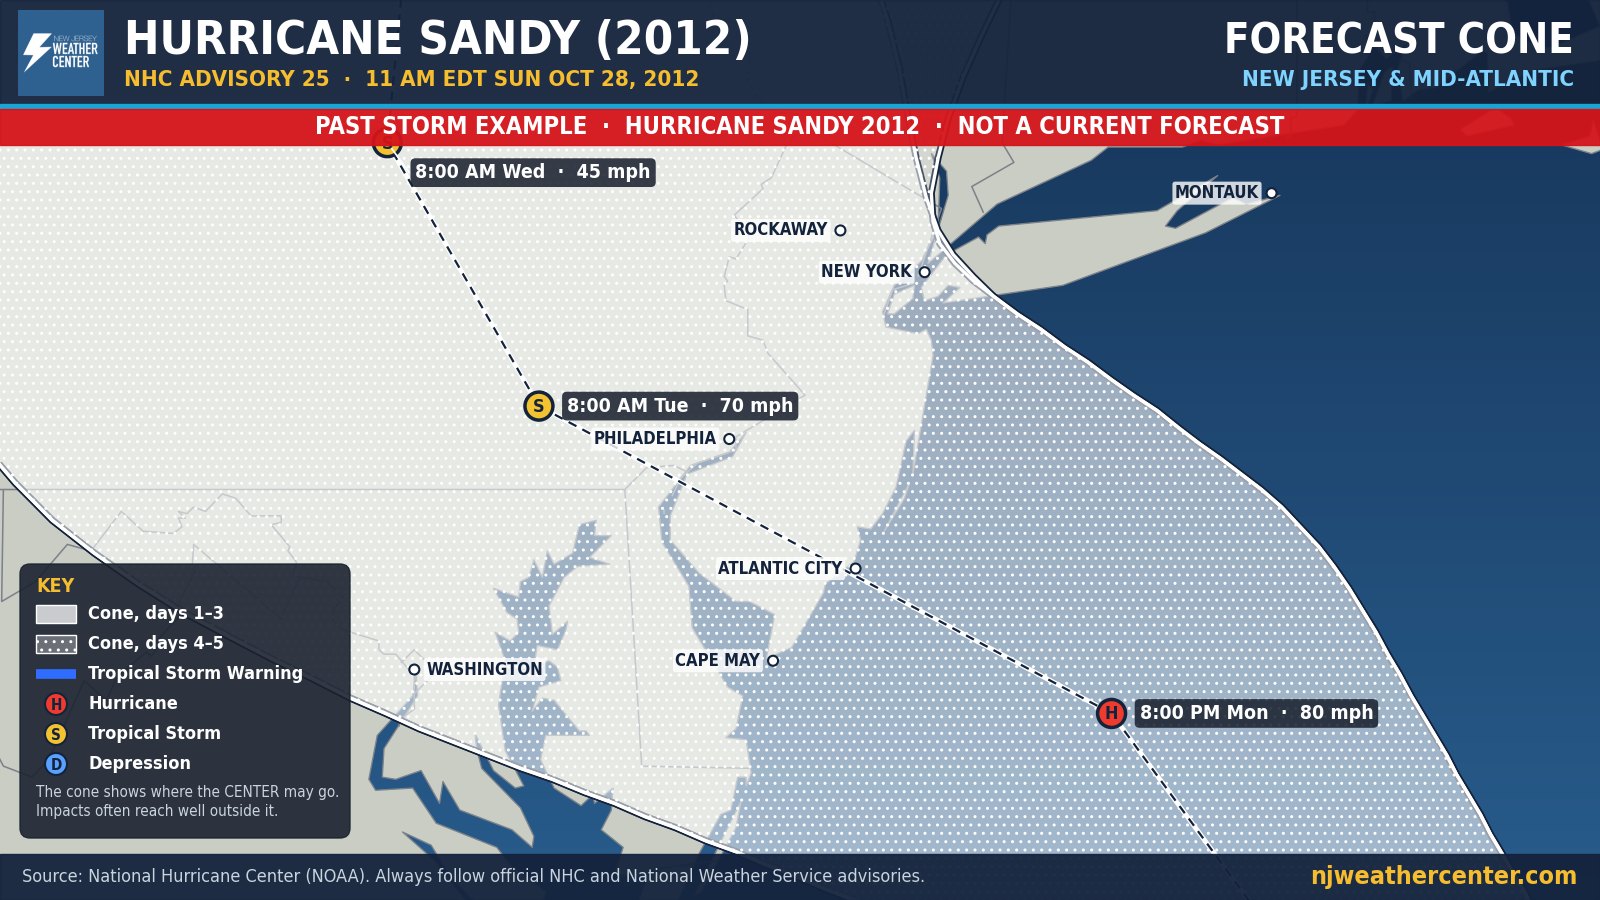
The official National Hurricane Center cone, track and strength, in views from the whole Atlantic down to New Jersey.
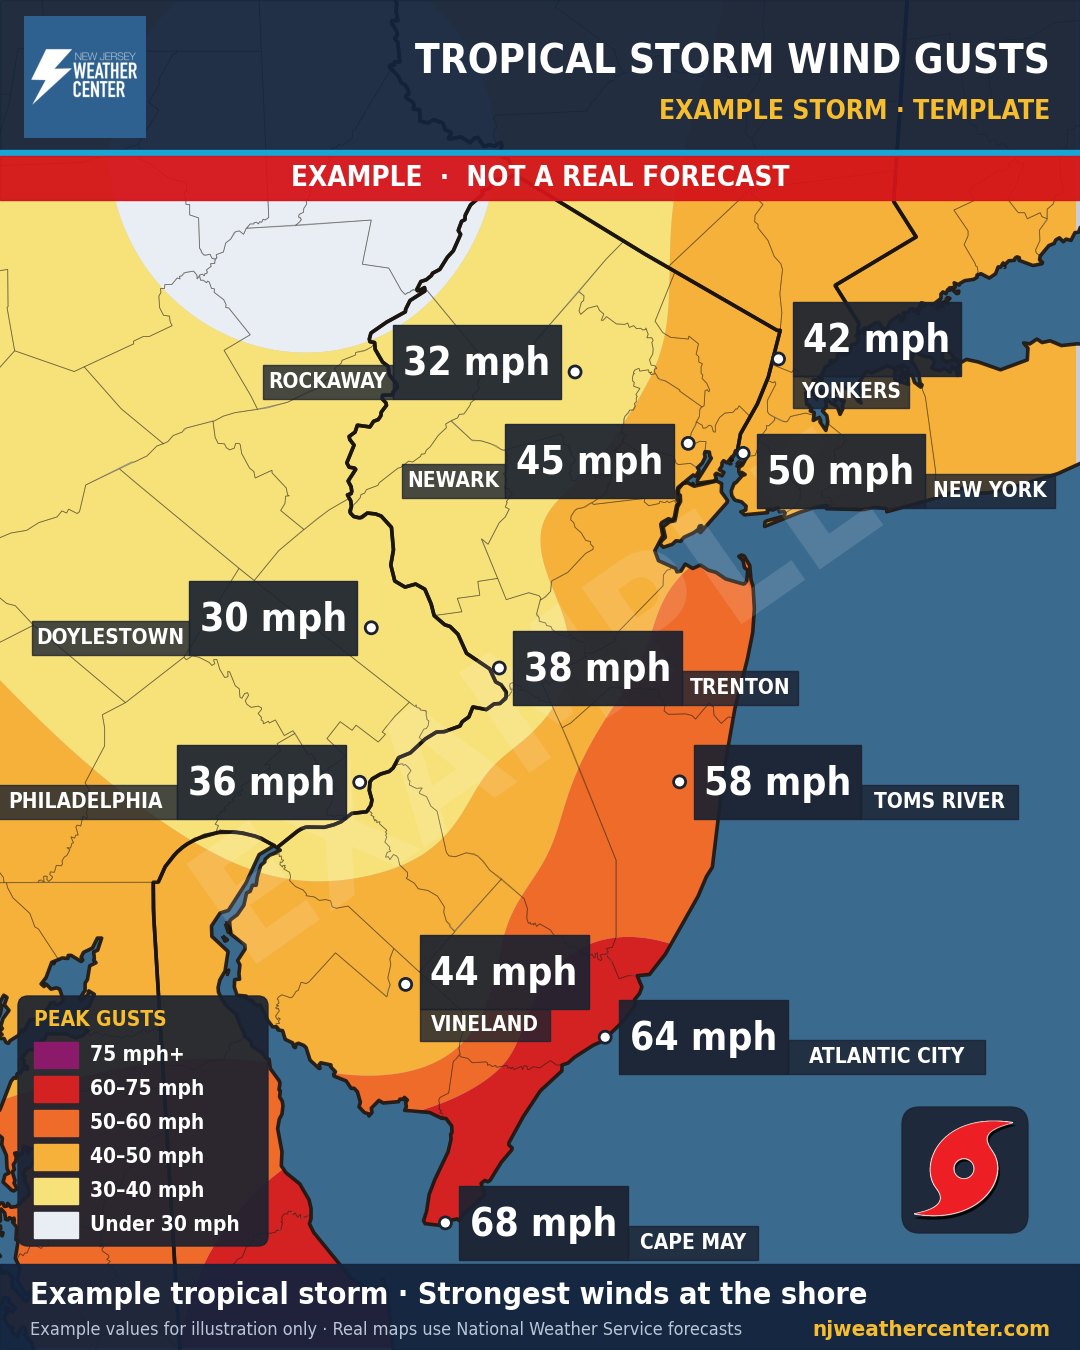
Peak wind gusts town by town when a tropical system gets close.
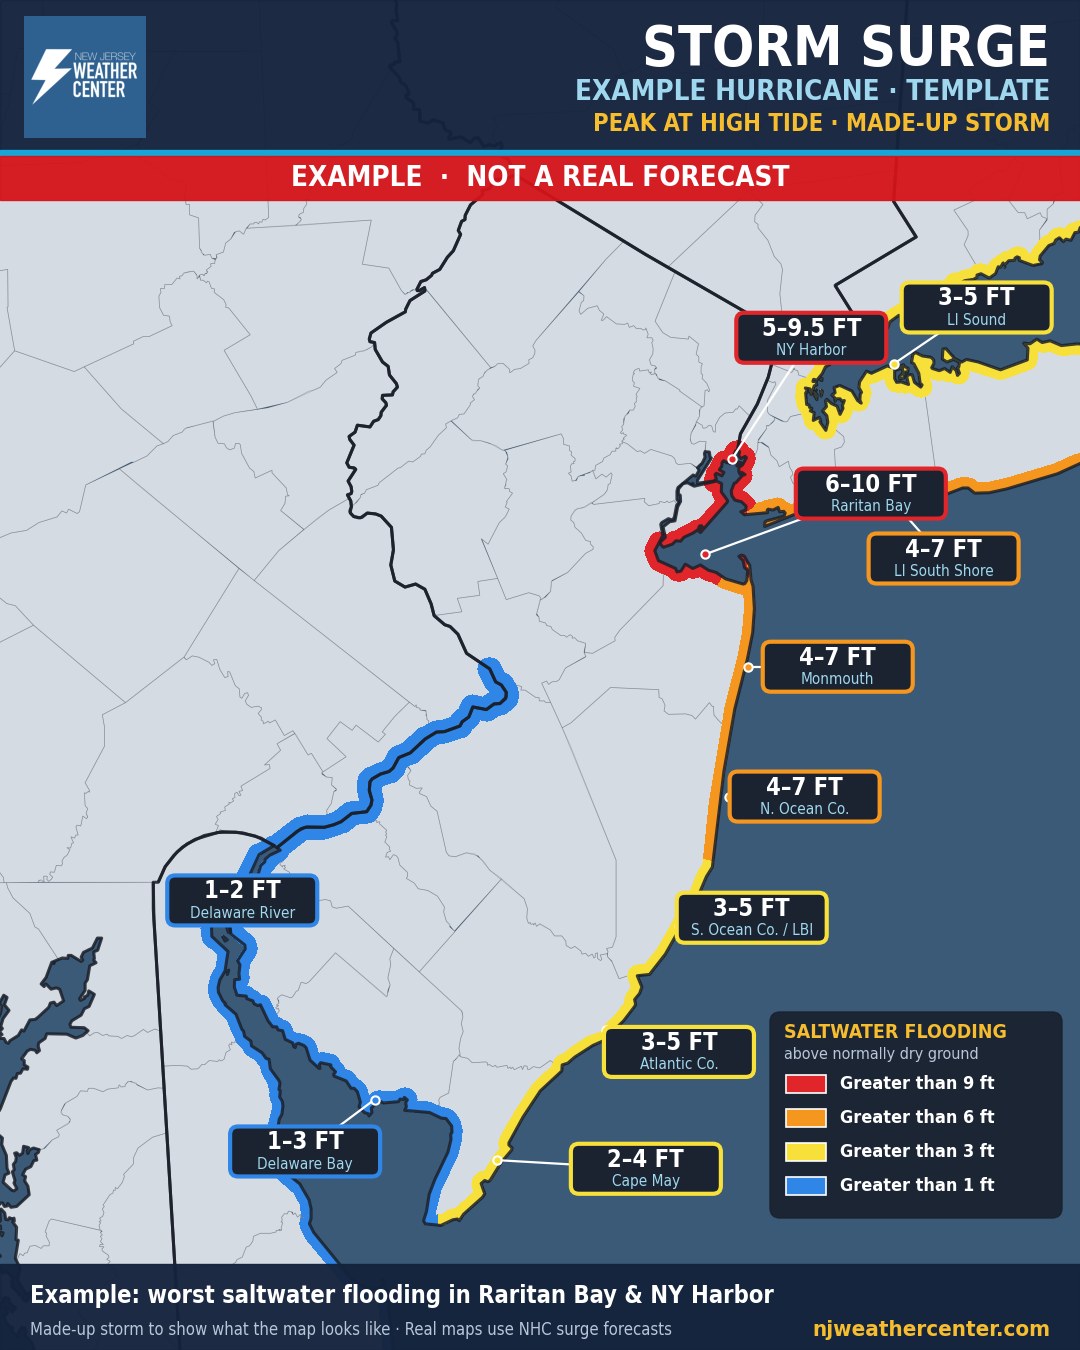
How deep saltwater flooding could get along each stretch of the coast, back bays and rivers.
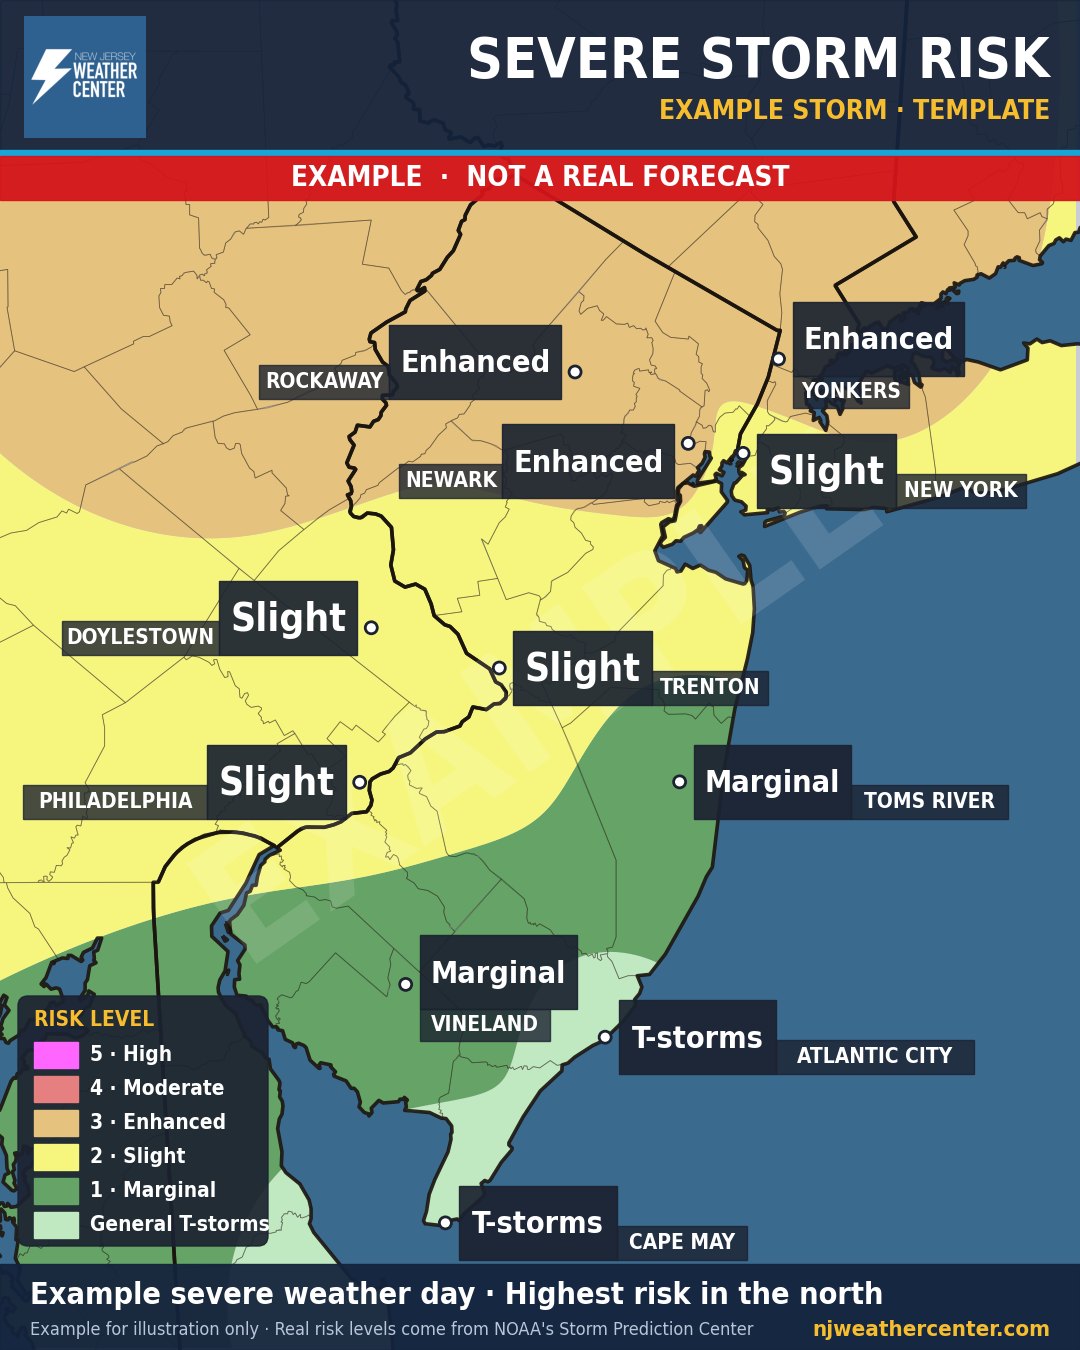
Where strong storms are most likely and what to expect: wind, hail, flooding.
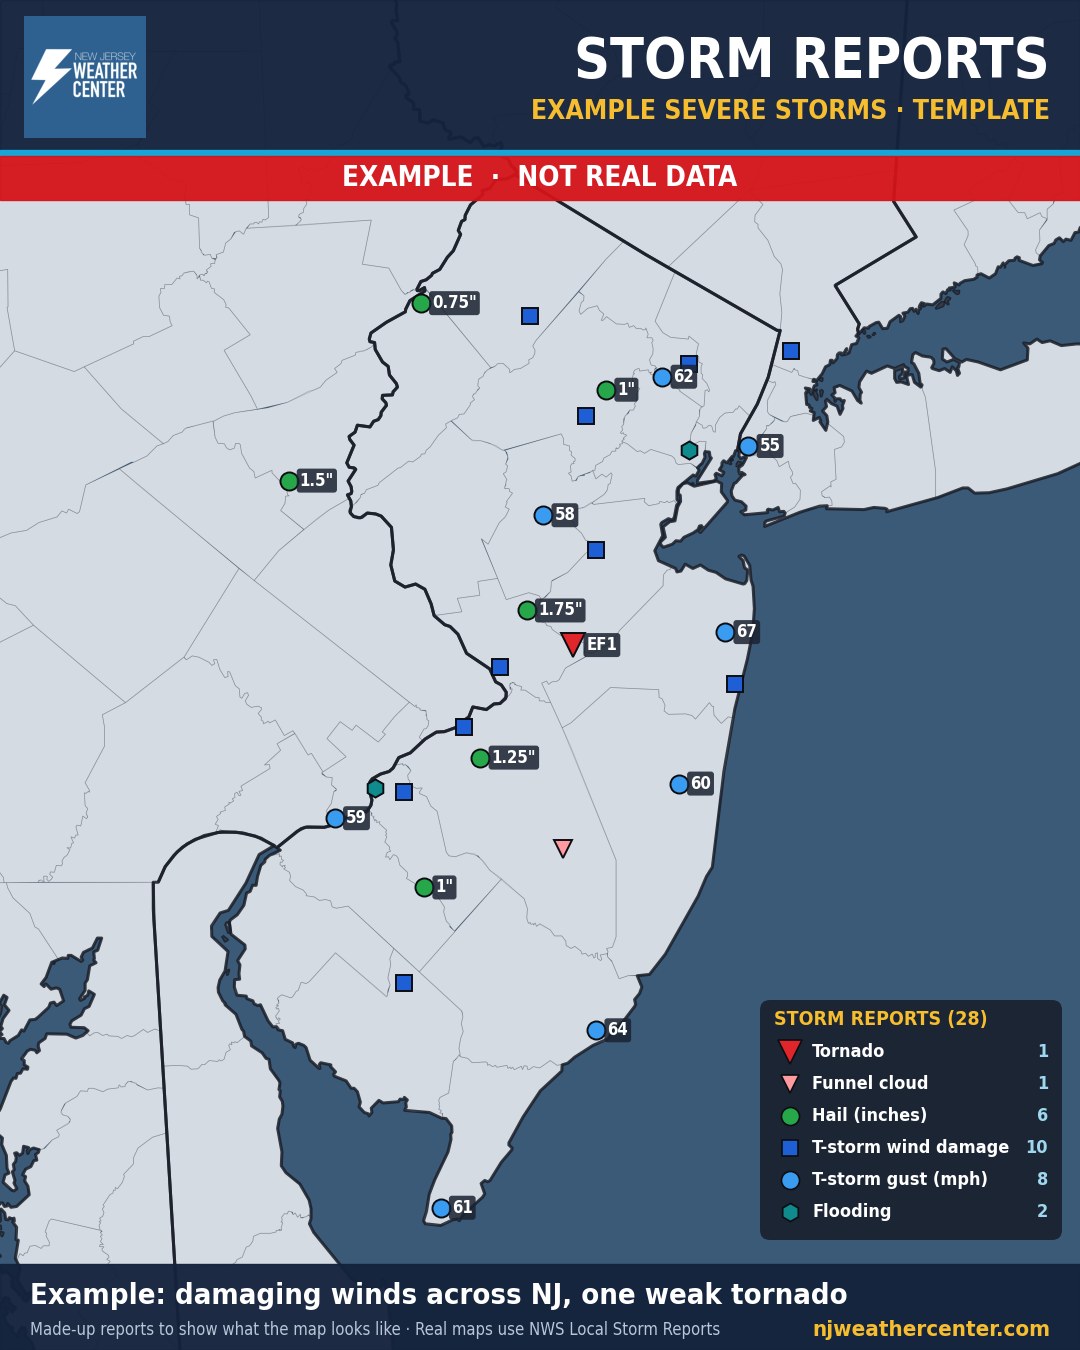
What actually happened: tornado, hail, wind damage and flooding reports from the National Weather Service.
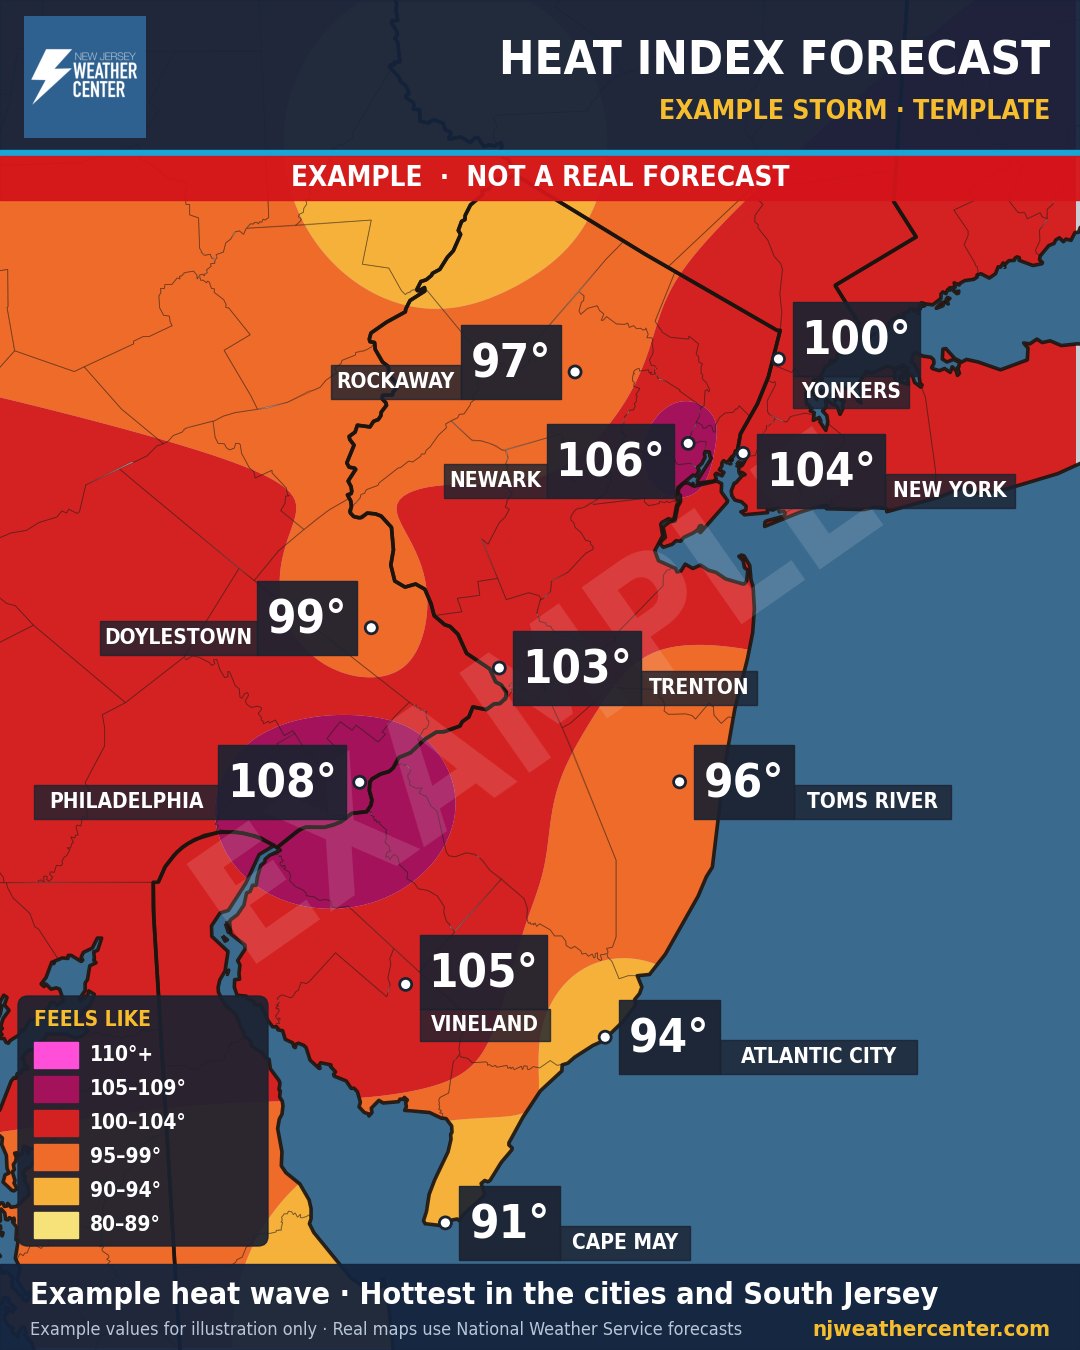
What it will actually feel like outside when it gets extreme.
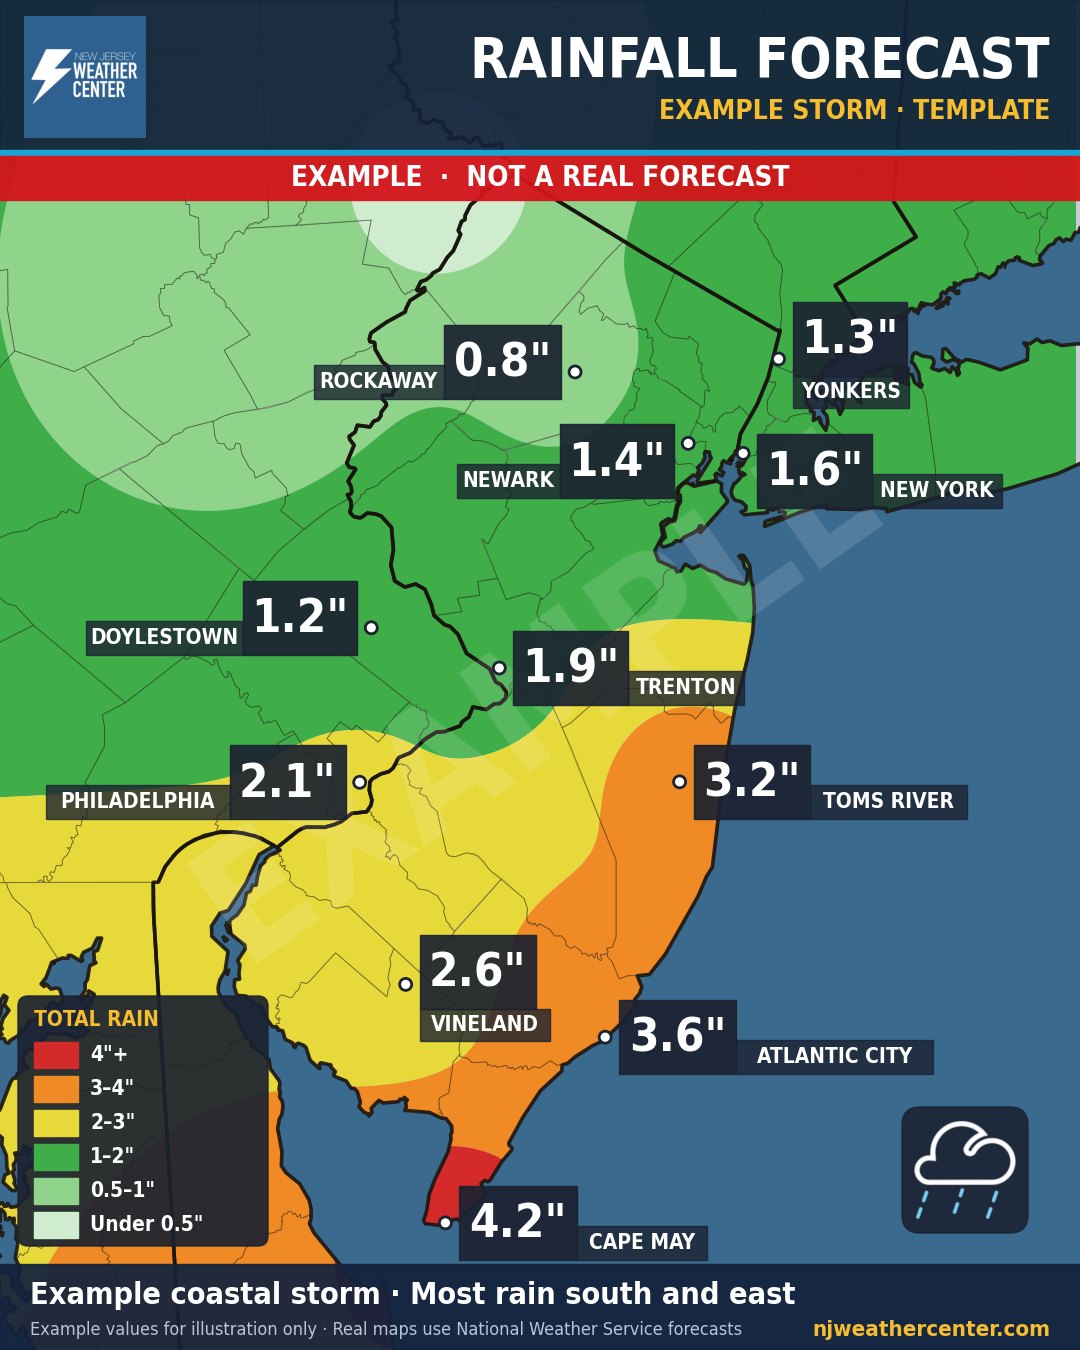
How much rain to expect and where flooding is most likely.
Storm Center
When a big storm is coming, it gets its own page: the snow or rain map, timing, wind, and a Storm Impact Index for your commute. The page is updated as the storm gets closer. Nothing active right now.
- Snow or rain map
- Timing
- Wind
- Commute impact