
What we post / Tropical Tracking
Tropical Tracking
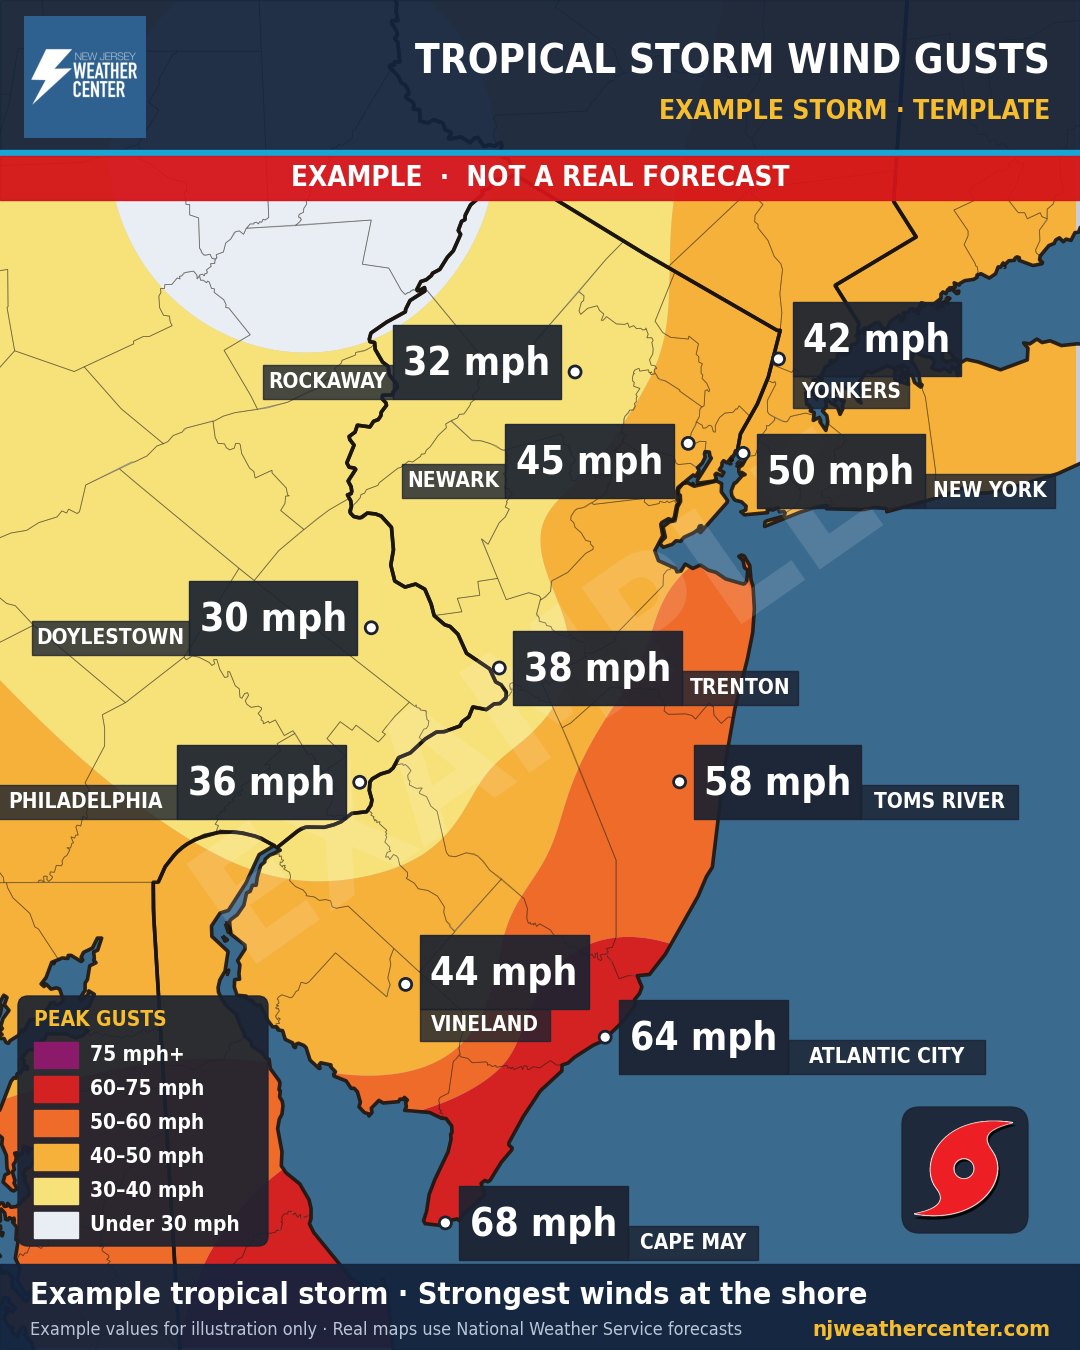
Example map. This storm is made up to show what the map looks like. It is not a real forecast.
What it shows
What a tropical storm or hurricane could mean for our area: peak wind gusts, the timing, and where impacts are worst, usually right along the shore.
How to read it
- The colors are peak wind gusts in mph. The key shows each range.
- City boxes show the expected peak gust for that city.
- Tropical storms have sustained winds of 39–73 mph, and hurricanes 74 mph or more. Gusts can run higher than sustained winds.
When we post it
When a tropical system is forecast to affect our area. Forecast cone maps are posted with every new National Hurricane Center advisory.
Where the numbers come from
Track, timing and wind from the National Hurricane Center and the National Weather Service. For dangerous weather, always follow official National Weather Service warnings and your local emergency officials.
Forecast cone maps
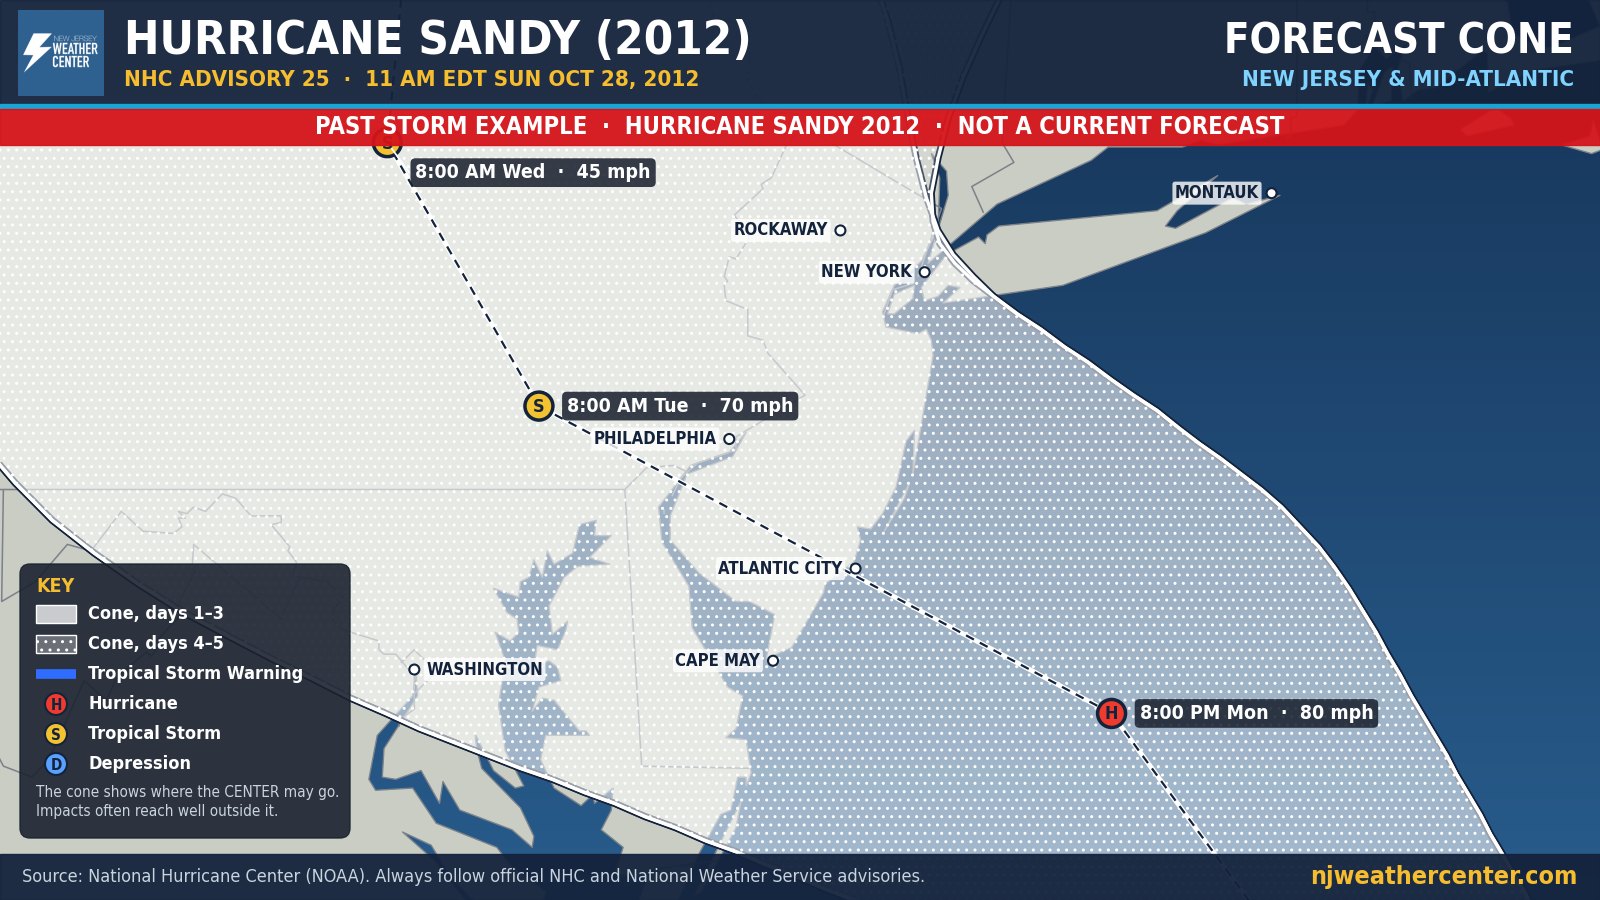
When a tropical storm or hurricane is headed up the coast, we post the National Hurricane Center's official forecast cone in several views: the whole Atlantic, the East Coast, the Northeast, and a close-up of New Jersey and the Mid-Atlantic.
Past storm example. Real NHC data from Hurricane Sandy (2012). It is not a current forecast.
How to read the cone
- The white cone is where the center of the storm will probably track. Solid white covers the first 3 days, and the dotted part covers days 4 and 5.
- Each dot on the track is a forecast position. The letter is the expected strength (D = depression, S = tropical storm, H = hurricane, M = major hurricane), with the time and wind speed next to it.
- Colored lines along the coast are official watches and warnings. Red is a hurricane warning, pink a hurricane watch, blue a tropical storm warning and yellow a tropical storm watch.
- Impacts like wind, rain, surge and flooding often reach far outside the cone, so don't focus only on the line down the middle.
Storm surge maps
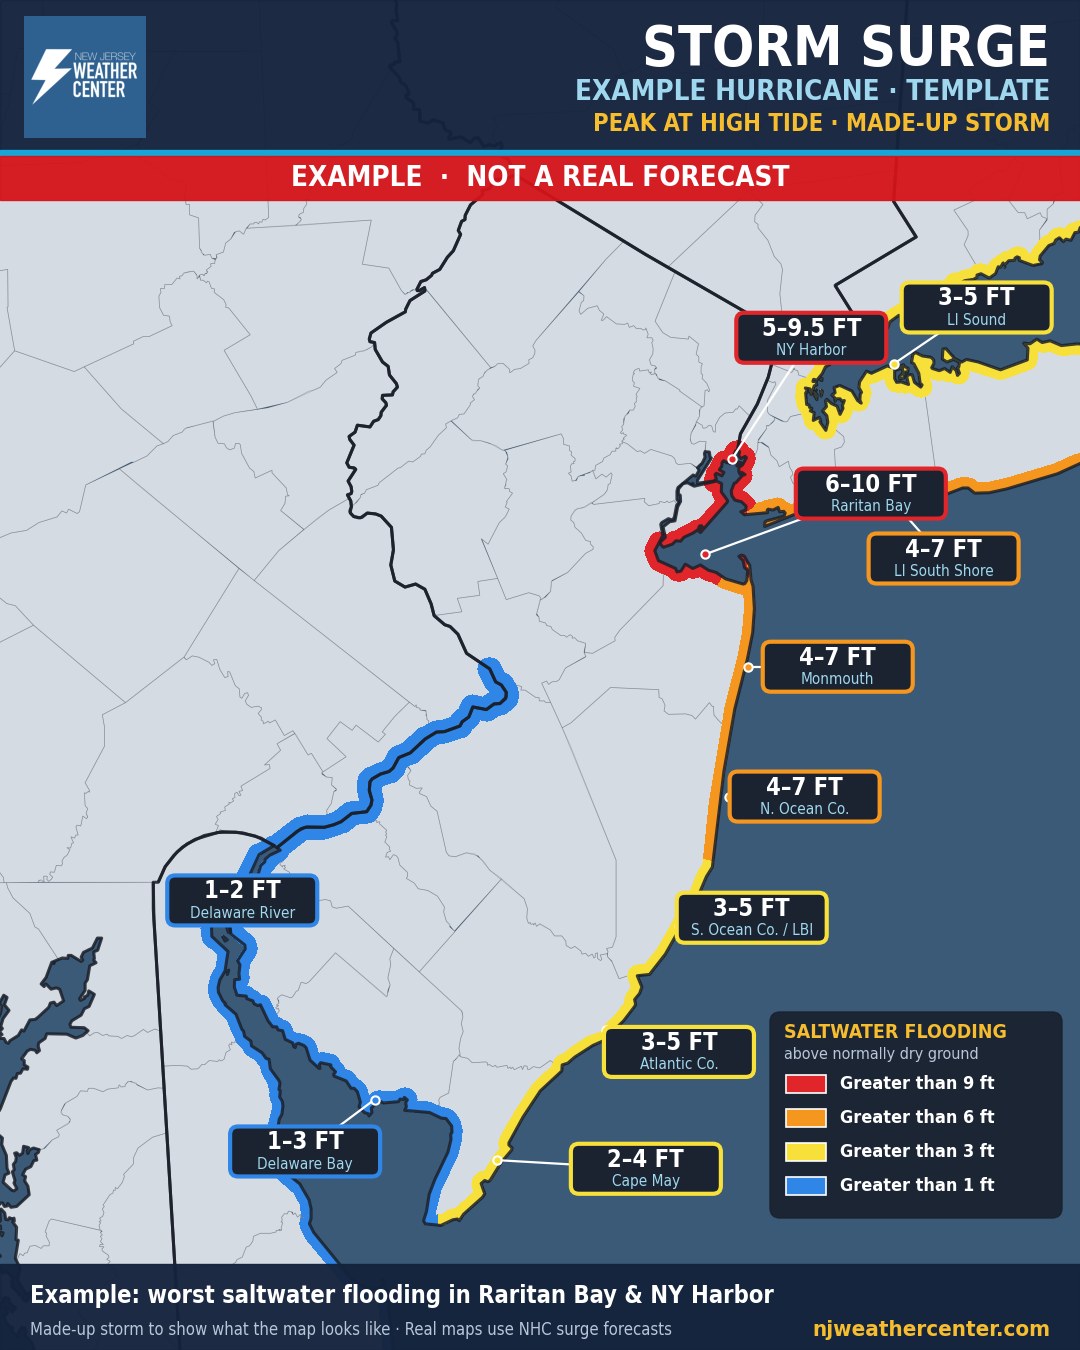
Storm surge is ocean water pushed onto land by a storm. It is usually the deadliest part of a hurricane. When the National Hurricane Center forecasts surge for our coast, we outline each stretch of coastline in the color of how deep the saltwater could get above normally dry ground.
Example map. This storm is made up to show what the map looks like. It is not a real forecast.
How to read the surge map
- Each stretch of coast is colored with the National Hurricane Center's surge categories: blue more than 1 foot above ground, yellow more than 3 feet, orange more than 6 feet and red more than 9 feet.
- The boxes give the forecast range for that stretch of coast, like "4–7 FT". The color goes by the high end, because that's what to plan for.
- The numbers are the peak if the surge arrives at high tide. Back bays, inlets and rivers like Barnegat Bay, Raritan Bay and the Delaware River can flood too, not just the beachfront.
- If local officials order an evacuation for your area, leave. Don't wait to see how high the water gets.